Online analytical processing (OLAP) systems are commonly used in many Business Intelligence, Analytics and Data Science applications. According to Wikipedia, “OLAP is an approach to answer multi-dimensional analytical queries swiftly in computing”.
Compared to traditional relational database systems, the main difference is that the data in an OLAP system is being stored in a pre-aggregated and multi-dimensional form. The main benefit of storing data in such form, is that it is optimized for ad-hoc complex aggregations. For example, by storing pre-aggregations using different levels of granularity (hourly, daily, weekly, etc.), we can efficiently answer questions like “what were the monthly sales before two years?”, or “what is the average time that the users are spending in a day using a specific feature of our service the past 90 days?”. Furthermore, we may need to dive to a more detailed view at any time and recalculate the aggregations over any other dimension of the data. Consider, for example, that now we would like to recalculate the aforementioned questions and group the results over every country around the world, in order to produce more detailed visualizations/reports/dashboards and help to decision making.
Such answers are not impossible to be gathered from relational databases, but the complexity of schema design and maintenance, along with the requirement to able to answer “efficiently” such complex ad-hoc aggregations may result to a data engineering nightmare (multiple tables, indexes, possibly multiple databases and custom ETL tasks).
In brief, the main characteristics of OLAP systems are outlined below:
- Keep the timeseries of the data — e.g., able to know the evolution of a metric value.
- The queries that analysts usually perform are ad-hoc, thus the system should be able to answer any business question without the need of schema engineering. The data should be collected and queried quickly for any dimension.
- In contrast to relational databases, the data may be stored with a lot of redundancy. This is desired, either for improving the speed of collecting the results (e.g., avoiding joins), or due to the need of having the evolution of the data in a timeseries.
- To answer business questions, it may needed to scan large amounts of data.
The main concepts behind an OLAP system are the following:
OLAP cubes: You can consider a cube as a multi-dimensional generalization of a spreadsheet. For example, consider that we would like to have the sales by country, by some time periods (e.g., per week, per month, quarterly and annually), as well as by any other possible dimension (e.g., per region, city, service feature, etc.).
The pre-calculation of all possible aggregations in a cube would be the ideal case for the fastest possible answer response time for any query, however it requires significant processing time and storage. Depending on the business requirements, the configuration of the system and the type of the aggregation, we usually set which aggregations are going to be fully pre-calculated during data ingestion — thus, any other aggregation is calculated on-demand during query computation.
There are many commercial and open-source OLAP systems, a brief comparison can be found in Wikipedia. As the title of this article reveals, we are going to focus on Apache Druid, a distributed data store designed for high-performance slice-and-dice analytics (OLAP-style) on large data sets.
Apache Druid
Apache Druid was created by advertising analytics company Metamarkets and so far has been used by many companies, including Airbnb, Netflix, Nielsen, eBay, Paypal and Yahoo. It combines ideas from OLAP databases, time-series databases, and search systems to create a unified system for a broad range of use cases. Initially, Apache Druid became an open-source software in 2012 under the GPL license, thereafter in 2015 changed to Apache 2 license and in 2018 joined the Apache Software Foundation as an incubating project.
What Druid provides to deal with OLAP-like queries:
- For storage efficiency and fast filtering over dimensions of data, Druid stores data in a column-oriented compressed format (see Column-oriented systems and Column-Oriented Database Systems). Therefore, it can deal with data redundancy and at the same time it uses an efficient format for performing queries over multi-dimensional aggregations and groupings.
- The schema of any datasource (i.e., a table in Druid) is very flexible and can easily evolve.
- The data are being partitioned based on time, thus timeseries queries are significantly faster than traditional databases.
- Druid provides out-of-the-box algorithms for approximate count-distinct, approximate ranking, and computation of approximate histograms and quantiles.
- It is highly scalable and has been used in production environments with millions of events per second and storage of years of data.
- Sub-second average response time of queries.
- Fault-tolerant architecture.
- Integration with state-of-the-art big data technologies, including Apache Kafka, Apache Flink, Apache Spark and Apache Hive.
- Provides a native JSON based language, as well as SQL (experimental) over HTTP or JDBC.
- Supported by high-level business intelligence and analytics data exploration and visualization tools like Metabase and Apache Superset.
How data are being stored
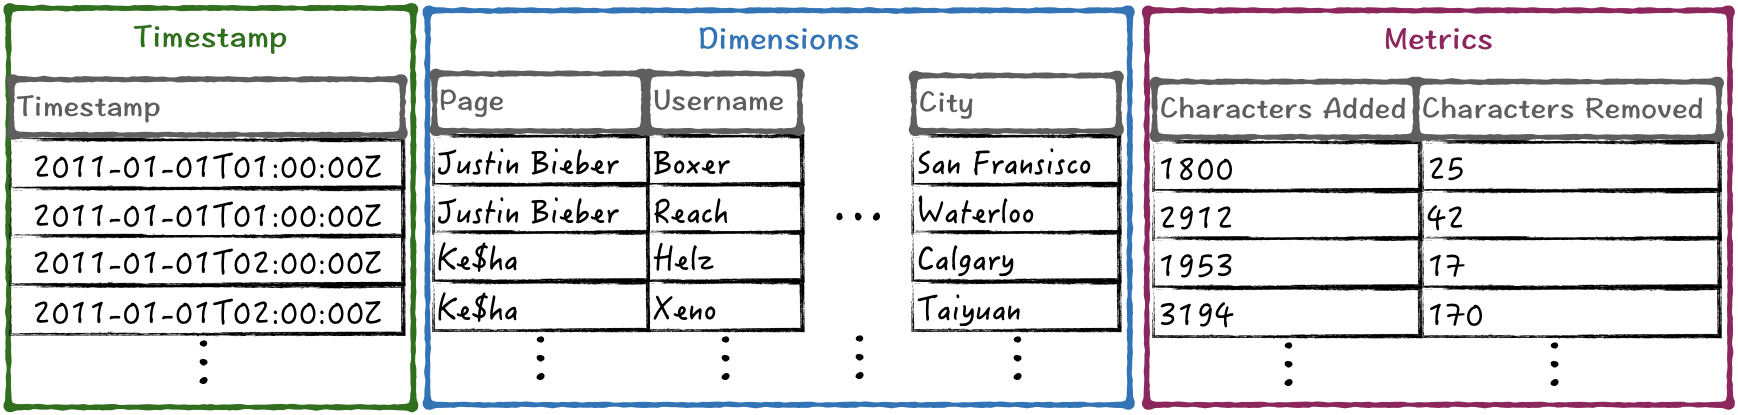
Tables in Druid are named as datasources and they are partitioned by time intervals. Each time interval is named as chunk and is composed of segments. A segment is an immutable data structure which is being periodically persisted. For example, you can set segments to be created once a day, or every hour, etc. As it is shown in Fig. 1, a segment is composed of the following three column types:
- Timestamp: the timestamp of the data (rolled-up or not).
- Dimension: a field of the input data that can be used to perform filter and group-by.
- Metric: a pre-aggregation (e.g., first, last, sum, max, etc.).
Segment core data structures
Each chunk can be composed of one or more segment files. Depending on the configuration of the data ingestion, the segments can be created either when the number of their records reaches some maximum threshold (e.g., five million of records) or when there are multiple concurrent ingestion tasks and thus each one creates a separate segment file, or the file size of the segment file in a task exceeds some threshold (e.g., more than 512MB). For more in depth details regarding segments you can read the official documentation.
Furthermore, you can specify the granularity of the data inside a segment. Assume, for example, that your need an hour-level granularity in your use case. You can setup druid to automatically aggregate your real-time data by hour. To illustrate how rollup works in Druid, consider for example, the following fragment of input data in JSON:
{"timestamp":"2018-01-01T01:01:31Z","user_name":"Boxer","city":"San Fransisco","characters_added":1000}
{"timestamp":"2018-01-01T01:02:16Z","user_name":"Boxer","city":"San Fransisco","characters_added":400}
{"timestamp":"2018-01-01T01:03:21Z","user_name":"Boxer","city":"San Fransisco","characters_removed":25}
{"timestamp":"2018-01-01T01:03:46Z","user_name":"Boxer","city":"San Fransisco","characters_added":400}
{"timestamp":"2018-01-01T02:05:41Z","user_name":"Helz","city":"Calgary","characters_added":1800}
{"timestamp":"2018-01-01T02:07:36Z","user_name":"Helz","city":"Calgary","characters_removed":17}
{"timestamp":"2018-01-01T02:10:06Z","user_name":"Helz","city":"Calgary","characters_added":153}
Each line is a json that represents a single input event. Field timestamp is the timestamp of the event expressed using the ISO-8601 standard, while characters_added and characters_removed are metrics. For the shake of simplicity the given fragment of data includes only two dimensions in the example JSON, that is user_name and city. By setting the rollup to hour-level granularity the above example will be aggregated into hourly records as it is shown in Fig. 1. For instance, the value of _characters_added in segment that corresponds to the interval 2018-01-01T01:00:00Z until 2018-01-01T02:00:00Z, is simply the sum of all its values within that interval (i.e., 1000 + 400 + 400 = 1800). For further details regarding rollup see the official tutorial.
A brief overview of the architecture
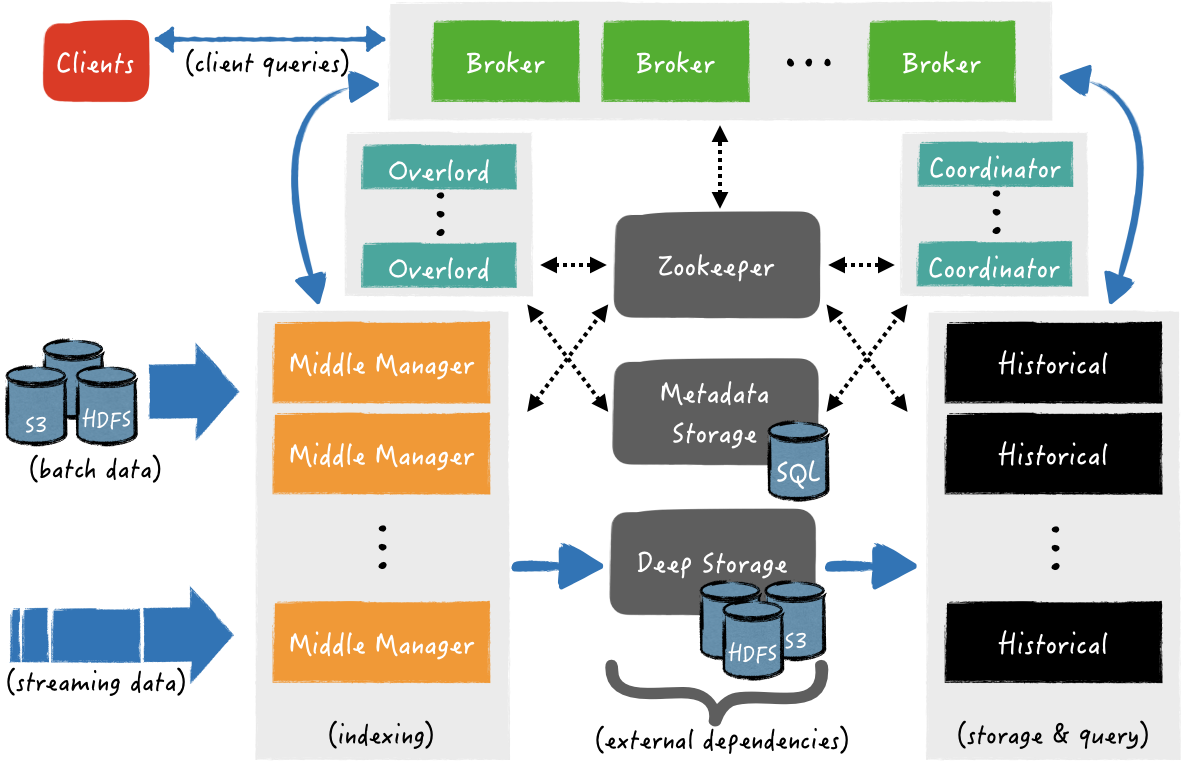
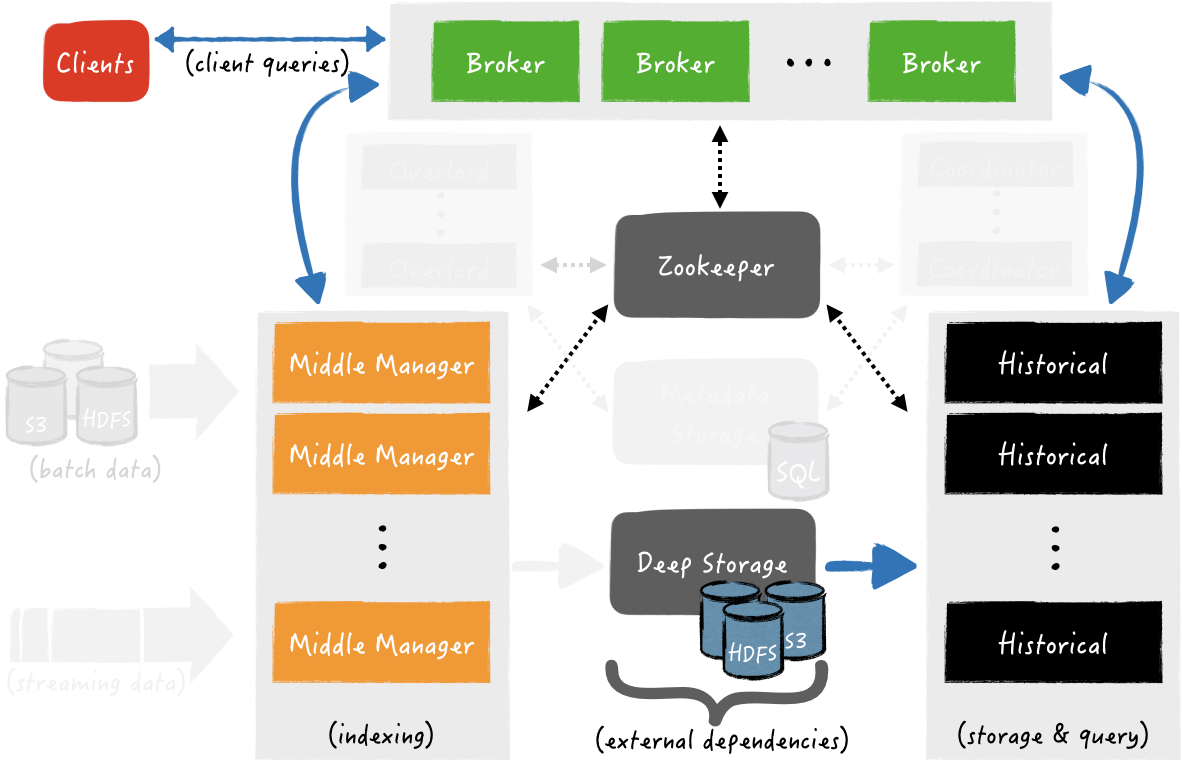
Druid has an architecture that is distributed and scalable. The design of Druid is driven by the requirements of having a highly available system, with flexible configuration and at the same time to be cloud-friendly and easy to operate. A diagram of the architecture is being shown below in Fig. 2.
Druid Architecture
First of all, Druid platform relies on the following three external dependencies:
Deep Storage: it can be any distributed file system or object storage, like Amazon S3, Azure Blob Storage, Apache HDFS (or any HDFS compatible system), or a network mounted file system. The purpose of the deep storage is to persist all data ingested by Druid, as a backup solution and at the same time to be available to all Druid components and clusters, when it is needed.
Metadata Storage: is backed by a traditional relational database system, e.g., PostgreSQL or MySQL. All metadata are available to any Druid component. There are various types of metadata in Druid, some are related to the persisted segments in deep storage, for example paths of segment files, their timestamp, their version, etc., other may related to external systems like the ingested partition offsets from a Apache Kafka topic and the rest are related to metadata of various internal processes (e.g., in which segments are being created now).
ZooKeeper: is used for internal service discovery, coordination, and leader election.
The architecture of Druid is composed of the following components of processing types:
- Middle Manager processes handle the ingestion of data into the cluster. For example, they are responsible to ingest real-time streaming data from Apache Kafka or load batches of data from some other source (e.g., files from HDFS).
- Historical processes handle the storage and querying on “historical” data. Nodes that are running Historical processes fetch segments from deep storage to their local disk and respond to queries about these segments.
- Broker processes receive queries from external clients. They identify which Historical and Middle Manager nodes are serving those segments and send a rewritten sub-query to each one of these processes. Thereafter, they collect and merge the results and respond to the caller. Internally, Historical processes respond to sub-queries that correspond to segments of data that have been persisted to the deep storage, while Middle Manager respond to sub-queries that correspond to recently ingested data (i.e., in-memory data that hasn’t been published to the deep storage).
- In order to balance the data over the Historical and Middle Manager processes, Druid has Coordinator processes and Overlord processes, respectively. Coordinator processes, specifically, are responsible for assigning segments to specific nodes that are running Historical processes. Similarly, Overlord processes, are responsible for assigning ingestion tasks to Middle Managers and for coordinating segment publishing.
- Finally Router processes, provide a unified API gateway in front of Brokers, Overlords, and Coordinators. Their use is optional since you can also simply contact the Brokers, Overlords, and Coordinators directly.
As it has been outlined, Druid is composed of separate components for ingestion, querying and coordination. Each Druid process component can be configured and scaled independently, giving you maximum possible flexibility, as well as a robustness to fault tolerance (since an outage of one component will not immediately affect other components). Furthermore, the separation of deep storage and the metadata store from the rest of the Druid system gives the ability to relaunch a component or an entire cluster from data that is has been persisted in deep and metadata storage.
Data ingestion flow
Data ingestion flow is a two part process. In the first part, Middle Managers are running indexing tasks that create and publish segments to Deep storage. In the second part, the published segments are fetched from Deep storage by Historical processes, in order to be used in query answering.
Indexing: Segments Creation and Publishing
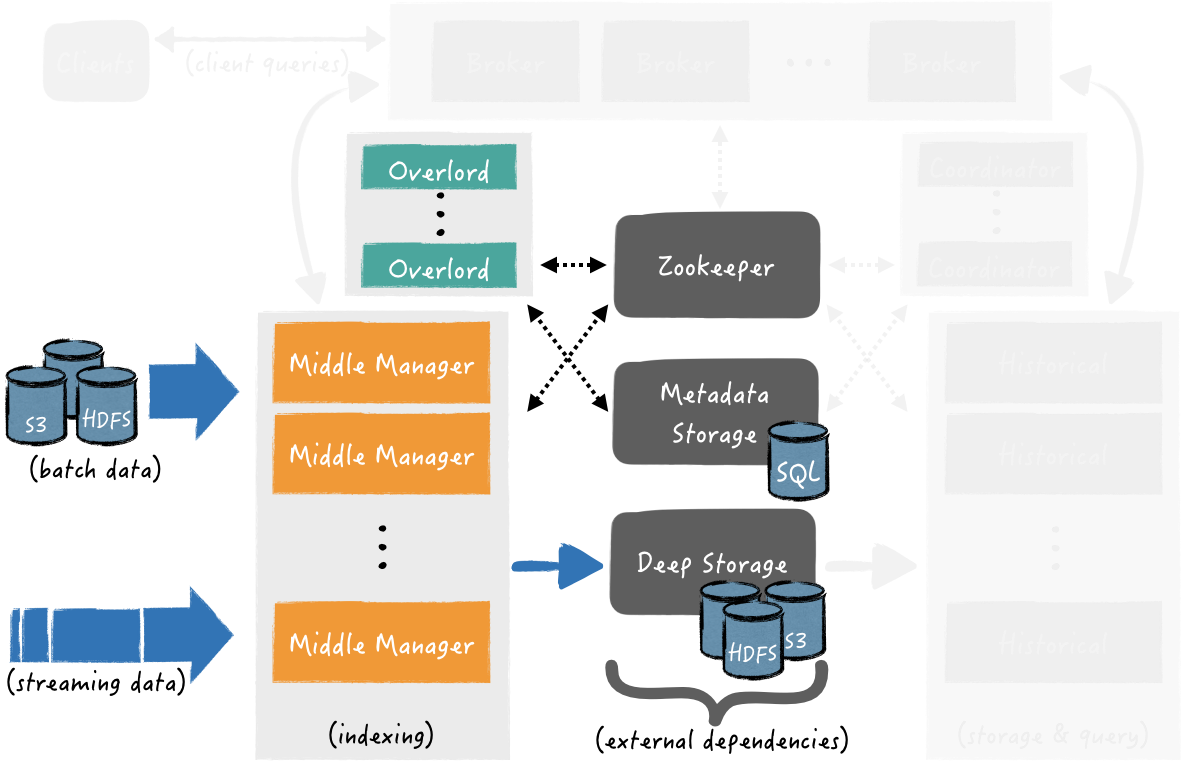
Middle Managers are responsible for the ingestion of external data sources e.g., batch ingestion of files in HDFS or streaming ingestion from Kafka. The diagram in Fig. 3 highlights the components that take part during data ingestion, while the rest ones have been grayed out. During ingestion, the data is indexed, pre-aggregated, split into segments (w.r.t. the number of records, as well as the roll-up interval) and thereafter published into Deep Storage.
Indexing: Segments Creation and Publishing
The data ingestion from a data source may correspond to one or more ingestion tasks. For log and resource isolation, Middle Manager processes create and forward ingestion tasks to Peons — that is, separate JVM instances that handle a single ingestion task at a time.
At the beginning of an indexing task, a new segment is created. The input data of a segment may originate by a real-time stream (e.g., a Kafka topic) or by a batch of files (e.g., CSV files in HDFS). There are two types of ingestion modes:
- Append mode: When the input data source is a stream (e.g., a Kafka topic) or the batch indexing task is set to appending mode (i.e., read files and append an existing Druid datasource) the tasks add new segments to existing set of segments of the same interval of time.
- Overwrite mode: Old segments are being deactivated and replaced by the new ones having a new version number for the same interval.
One important feature of Druid, is that the currently creating segments from tasks that are real-time are immediately queryable — e.g., the records that are being consumed from Kafka are immediately queryable, despite that they haven’t published yet to Deep storage.
A task is completed either when it has indexed the maximum number of records per segment (e.g., five million records) or reached the desired rollup interval of time (e.g., hourly aggregates). At this point, the segment is published by persisting its data to the Deep storage and its metadata to the Metadata store.
Handoff: Published Segments Fetching for Query Answering
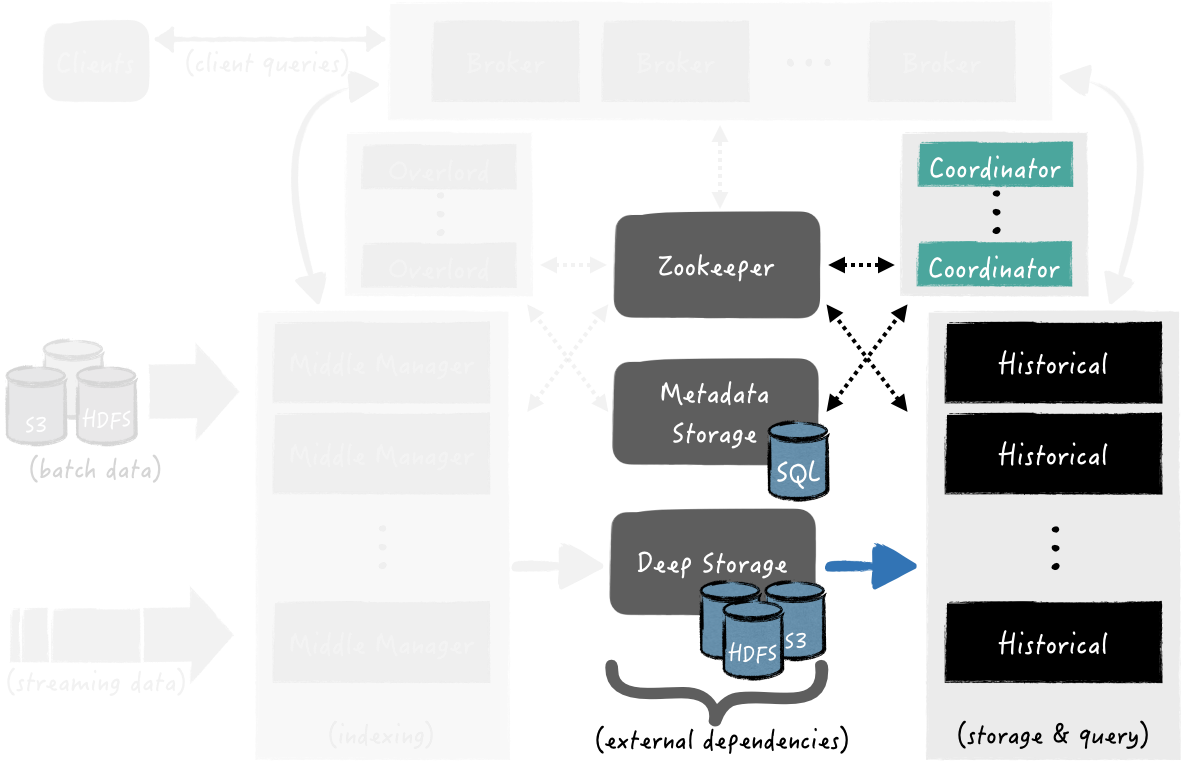
The diagram in Fig. 4 highlights the components that take part during handoff, the rest ones are grayed out.
Handoff: Published Segments Fetching for Query Answering
The Coordinator processes are periodically polling the Metadata store in order to find any newly published segments from data ingestion tasks. Once a newly created segment is being discovered by a Coordinator process, it chooses which Historical process should fetch the segment from Deep storage. When the segment has been successfully loaded, the Historical process is ready to serve it for querying.
Query Answering
Clients send queries directly to the Broker (or indirectly via a Router). A query can be expressed using the native JSON based language or the experimental SQL language. The type of the query can be any of Timeseries, TopN or GroupBy. All type of the aforementioned queries contain at least the target interval time, as well as the dimensions and/or the metrics of interest. The target interval of time is the information that Druid uses to decide which segments are required to be processed to answer the query. The diagram in Fig. 5 highlights the components that take part during query answering, the rest ones are grayed out.
Query answering
Once the query is being requested by a client, one of the initial tasks of a Broker is to identify the which processes serve the desired segments. For example, lets say that a we are interested to find “the top 10 users with the higher average time per hour the last 48 hours, starting from now”. The query requires both data that have been indexed and published to the Deep Storage, as well as segments from the currently ingesting data from Middle Manager processes. At this point, Broker sends the corresponding sub-queries to Historical and Middle Manager nodes, where each one will compute the requested aggregations and filterings and thereafter send back the results. Finally, Broker collects and merges the desired data, and thereafter responds back to the client with the final results.
Conclusions
OLAP systems are very powerful databases for serving ad-hoc queries with complex aggregations that are commonly used by Business Intelligence, Analytics and Data Science applications. The characteristics and concepts behind their design, differentiate them from traditional relational databases and make them ideal for such applications. This article gently presents the OLAP-like timeseries database Apache Druid, by outlining its architecture and the way that its components interact for data ingestion, indexing and query answering. As it has been illustrated, the architecture is cloud-friendly, easy to operate, highly scalable and flexible to configure. Having seen how data are being organized and how queries are being computed, in an upcoming article we are going to focus on the practical use of Druid with example queries using the open-source library Scruid.